
Fusion Charts Free for SharePoint (FCFS) provides a set of 22 different charts (2D & 3D) that integrates easily into your SharePoint environment (WSS 3.0 / MOSS 2007 / Sharepoint Foundation 2010 / Sharepoint Server 2010).
FCFS provides you a powerful way to display very nice looking charts into SharePoint with minimum effort.
Main Features
- Very nice looking charts (see below)
- 1 WebPart to display directly charts from SharePoint Lists (no coding)
- 1 WebPart to display charts from XML input (very flexible)
- Can export data to CSV or XML
- Easy installation and deployment
-
Compatible with Sharepoint Foundation 2010 & Sharepoint Server 2010 (manual deployment, see 2.0 release)
For picture gallery


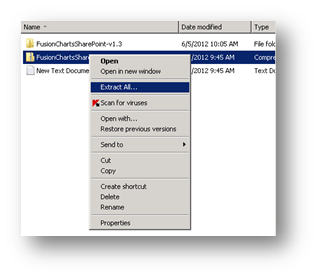
First we need to add the solution then deploy it
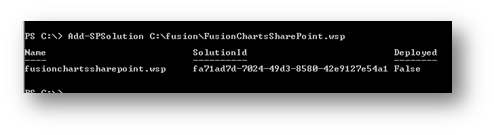
Open the sharepoint power shell then run the following to add the solution
Add-spsolution “path of solution”
Then go to central admin farm solutions choose the solution fusionchartssharepoint.wsp

Then doploy the solution 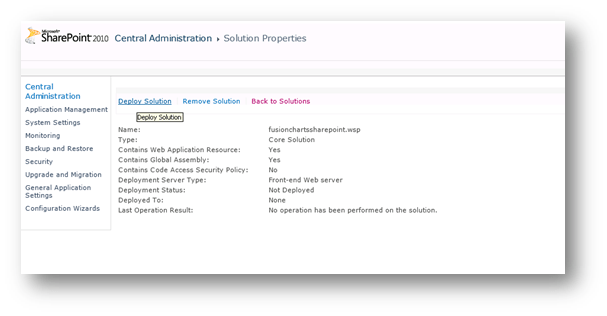
Choose now and choose the web application you want to deploy on

Then go to your SharePoint site
Site actions site settings

Site collection features under site collection administration

Search for the fusion charts SharePoint then activate 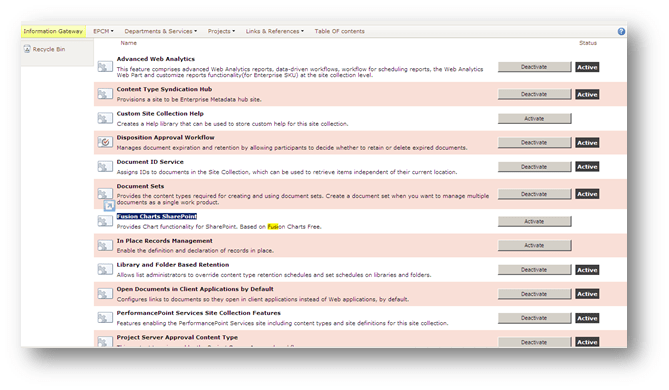
Site action edit page
Insert web part choose fusion chart

Chart from list And chart from xml as a test 
You can edit the web part and chose the chart type you need

In the edit web part go to fusion charts add the name of the list to be displayed
And the name of the columns

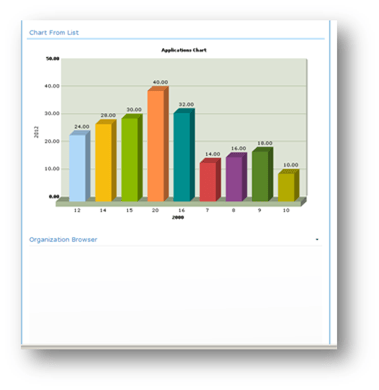
At the end you will get the charts
